Wednesday, November 1, 2023

Tehuantepecer in full force

A Tehuantepecer event is in full swing this morning, with winds analyzed by the GFS of around 60 kt at 850 hPa blasting into the Gulf of Tehuantepec. The Tehuantepecer is a local type of mountain gap wind primarily produced in the wintertime as cold airmasses surging southwards in the Gulf of Mexico result in a large pressure gradient between the Bay of Campeche and Gulf of Tehuantepec, forcing what can be a violent surge of wind through the Chivela Pass on the Isthmus of Tehuantepec. The diminishing Coriolis force southward of this mountain gap allows the outgoing channel of wind to continue outwards for what can be hundreds of kilometers.


This particular event played out in such fashion, with a dense, cold air mass surging south over the Gulf of Mexico yesterday -- the same airmass currently bringing anomalously cold temperatures to much of the continental US. The cross-isthmus pressure gradient may have been ever so slightly strengthened by nearby Tropical Storm Pilar, though the weak intensity of that storm and its small barometric footprint suggest its impact on this event was fairly insubstantial.

The area of clear skies in the Gulf of Tehuantepec directly downstream of this gap wind event is no coincidence. Winds upstream of the isthmus are forced upwards by topography but then isentropically descend downslope on the other side of the isthmus, adiabatically warming and forcing relative humidity values to plummet within the planetary boundary layer.


Tuesday, October 31, 2023

Hurricane Otis recovered from a weather station in Acapulco

Servicio Mareográfico Nacional UNAM operates two weather stations in the Acapulco area, of which one (located in the Acapulco port operated by the Administración del Sistema Portuario Nacional) measures and reports meteorological parameters. While this station stopped reporting during Hurricane Otis in the early morning hours of October 25, 2023, due to communication loss (a preliminary report with this dataset was published by SMN-UNAM here), the station remarkably managed to survive the hurricane and continued to log data offline. Miriam and Valente of UNAM were able to recover the data from the storm-stricken weather station, and the data they collected will undoubtedly be crucial in analyzing Otis's intensity.

The data itself, is, in short, incredible:

A maximum wind gust of 178.06 kt and a peak sustained wind (averaging period unspecified, but ordinarilly these tend to be 1-, 2-, 5-, or 10-minute) of 98.75 kt. The wind gust, exceeding 200 mph, is nearly the strongest gust ever observed by SMN-UNAM, though the National Hurricane Center has cast some doubts on the higher gust of 183 kt recorded during Hurricane Patricia in 2015. Sustained wind reports at major hurricane intensity are rare, so to see an observation here in a major city is fascinating and a testament to the strength of Otis and its impact in the city. A minimum pressure of 963.5 hPa was also reported by the station, which as anticipated is slightly higher than the minimum observed on Isla Roqueta given its farther distance from the center of Otis (which, although we generally know where it went, is still not very well resolved). My personal hunch is that Otis's central pressure was somewhere in the range of 938-950 hPa at its closest approach to Acapulco, but more rigorous analysis will be required to determine such a value more confidently.

Saturday, October 28, 2023

Strong temperature gradients and a strong jet over the US

A large polar airmass is sagging south across the Central US today, bringing with it decently below average temperatures juxtaposed against the above-average temperatures currently along the Gulf coast and the Eastern Seaboard.

That's a fairly strong gradient in the 850 hPa temperatures running from the Texas panhandle up through the Kansas City area and towards the east-northeast. This setup with cold air surging east of the Rockies as easterly flow runs up against the foothills and is forced south is a typical look for cold air outbreaks across central CONUS.

Taking a cross section across this temperature gradient, we can see an impressive vertical gradient in theta-e, with characteristically high static stability within the frontal zone. 

Just looking along the 850 hPa level, there's probably about a 1K/10km theta-e gradient along that transect. Thermal wind balance tells us that where there's strong horizontal temperature gradients, there's bound to be strong cross-gradient shear, and sure enough, check out the magnitude of those winds normal to that transect!

That's a tremendously large expanse of strong westerlies aloft, but that's just about what we'd expect given the sagging cold airmass that's producing behind strong meridional temperature gradients. Both the polar and subtropical jet cores are evident here. That subtropical jet is really high up, straddling the tropopause region and maybe even poking in the stratosphere. Models indicate intensification of that jet, which should deposit energy downstream and result in an zonally-extending jet core across the Pacific, as we see depicted on the GFS:

With how strong that jet core is, that signals oodles of synoptically-forced ascent in the left exit region over the North Atlantic west of the British Isles. This entire portion of the jet will take about a week to propagate past the Atlantic, so there could be several days of repeated cyclonic development over the North Atlantic with tracks into Western Europe. That could result in a prolonged period of onshore flow with significant fetch which could lead to very high waves in the Bay of Biscay and surrounding environs:

Friday, October 27, 2023

Estimating Hurricane Otis's landfall trajectory using Schloemer

During Hurricane Otis's final approach of the coast of Guerrero, no Hurricane Hunters flew into the storm as the last flight was earlier in the afternoon. The storm's initially clear eye collapsed right around the time of landfall, so we don't have the best handle on Otis's intensity during that period without precise information about the storm's pressure field and the storm's position.

However, two weather stations in the Acapulco survived the storm and recorded wind and pressure data throughout the storm passage. It is unclear how far they were from the actual center of circulation. Based on the wind data, it does appear that Otis passed just west of downtown Acapulco, but by how much remains an open question. 

As a point of curiosity, I decided to use the pressure data to try to guesstimate where the Otis's center of circulation was located. In 1954, Robert W. Schloemer of the old U.S. Weather Bureau's Hydrologic Services Division developed a method for estimating the central pressure of a storm by way of accounting for a peripheral pressure measurement, the storm's size, and the distance to the center. The theoretical "Schloemer equation" has since been used to estimate storm intensities, particularly in the context of reanalyses of the Atlantic hurricane database.

Using the pressure data available (adjusted to sea level), one possible method for determining the storm's location is to determine what location would minimize the standard deviation of central pressure estimates derived the various peripheral observations, and I decided to put this to the test with four sparsely located stations in southwestern Mexico:

Standard deviation of central pressure estimates for theoretical storm positions (contours), interpolated pressure observations (blue values), winds (barbs), gusts (arrows), and GOES-16 channel 13 infrared radiance (shading)

Unfortunately, due to the limited number and sparseness of observations, as well as the mountainous terrain which likely distorted Otis's pressure field, this method did a very poor job of resolving Otis's location, and I don't think there's much we can glean from this, though it was a fun exercise.

I'm of the opinion that Otis passed near Acapulco but then jogged to the west along the immediate coast upon encountering mountainous terrain, eventually moving inland perhaps 20-30 miles to the west. I've largely based this suspicion a J01/ATMS overpass at around 08:00 UTC, which suggests the storm drifted westward up the coast and made landfall later than the NHC operationally indicated:

Could this Schloemer-based method actually work with more data? Here's the same technique used on a small sampling of stations in Florida for Hurricane Ian's approach of the southwestern Florida coast in 2022:

The track location itself is not very good, but it seems that with more stations, we're able to get a general sense of motion unachievable with very sparse stations.


Thursday, October 26, 2023

Sting jet-like feature in Hurricane Tammy's extratropical phase

The National Hurricane Center declared Hurricane Tammy extratropical early on the morning of October 26 following a roughly week-long trek across the western tropical Atlantic, Barbuda, and the open Atlantic. Thermal and kinematic fields from the global and hurricane guidance suggest that Tammy may fully or partially re-acquire tropical characteristics this weekend, and personally I think the odds of that occurring are higher than what the NHC has been implying.

Anyhow, GOES-16 imagery from this morning showed what appeared to be a fast-moving swath of sharply-marked subsidence to the south and southeast of Tammy's center of circulation, not too unlike that of a sting jet.

Of course, Tammy does not appear to be rapidly deepening, and the banded scorpion-tail cloud head structure typically ascribed to sting jets is notably absent, but there does to be some implication of descent originating from near the convective region to the west. Water vapor-band brightness temperatures were also elevated in this apparently subsident region. Unfortunately, METOP-B and METOP-C missed this region in their morning passes, so we don't have an estimate of the winds there. However, SSMIS-derived wind data indicated a zone of stronger winds in the subsidence region.

The CIMSS meso-AMV product also suggested winds on the order of 50-70 kt within this sting jet feature at the 701-1000 hPa level.

The HWRF appears to have replicated this feature in its 06z run from this morning, showing a strong region of rapid descent (>3 Pa/s) in this area of the storm in tandem with a tangential isotach tail in the horizontal near-surface wind field:


HAFS-A also illustrated expansive descent:

As did HAFS-B:

If we consider strictly isentropic motions along the theta-e contours depicted, we may be seeing the transport of air from 600-700 hPa down to near the surface.


Wednesday, October 25, 2023

Hurricane Otis: rapid intensifcation via powder keg?

Hurricane Otis was a worst-case scenario for Acapulco, Mexico. What was initially forecast to be a weak tropical storm meandering off the southern Mexican coast turned into a "nightmare scenario" as National Hurricane Center forecaster Eric Blake wrote in his forecast discussion on the night of October 24: an explosively intensifying Category 5 hurricane on approach to a major metropolitan area. The extreme strength and rate of intensification surely caught everyone off guard. Just 24 hours before the NHC released their advisory upgrading Otis to a Category 5, the agency listed Otis as a mid-grade tropical storm with winds of 45 knots, forecasting a storm perhaps nearing hurricane intensity by the time it made landfall near Acapulco. Despite meager depictions from the dynamical and statistical hurricane guidance, Otis struck faster and vastly more powerful than just about every model projection, by far. Probabilistic forecasting aids did not show high likelihoods for rapid intensification, and yet Otis's winds ramped up 95 knots in just 24 hours, a rate nearly rivaling Hurricane Patricia.

So... what in the world happened?

I'd like to suggest a possible evolution of events that led up to Otis's unforeseen intensification. While the degree of intensification and the finer details are probably highly stochastic and entangled in complicated cloud physics and mesoscale processes, there may be some elements of the environment that we can use to piece together the Otis puzzle. 

The environment surrounding Otis early in its development was moderately sheared, and on October 22-23, Otis acted the part: its deep convection was weighted west of the center, downshear of the deep-layer shear vector. Roughly 25 kt easterly winds were present in the upper troposphere while 5-15 kt westerlies occupied the mid-troposphere between 400-600 hPa. It would not be a surprise to see a tropical cyclone having some small to moderate difficulties organizing and intensifying in such conditions.

GFS analyzed 450 hPa winds (vectors), theta-e advection (shading), and MSLP on October 21

But: the numerical weather models suggest that Otis had a trick up its sleeve that allowed it to weather this shearing flow aloft. Cross-sections through Otis in the model depictions, including on the GFS, HWRF, and HAFS-A/B, showed that Otis's vortex was concentrated in the low- to mid-troposphere below 600 hPa between October 22-23, where the environmental winds were calmer (on the order of 0-5 kts) and better aligned (fairly uniform easterlies or southeasterlies). The associated latent heat release from convective activity was also concentrated in this region underneath the hostile conditions above, resulting in positive potential anomalies being entirely focused around 700-850 hPa with little upward growth. Something was preventing the vortex to build aloft, allowing moist static energy to accumulate below. It's unclear what the cause of this cap was: Otis's modeled vortex capped out at around 600 hPa. Above this layer was the mid-tropospheric moist static energy minimum, so Otis's parcels were reaching their level of detrainment as they rose to that level, perhaps quickly entraining the energy-deficient layer. GFS analyses indicate that lower theta-e air at 400-600 hPa may have been advected from the Gulf of Mexico into the eastern Pacific on October 21-23 after nearby Hurricane Norma squashed a nearby mid-level ridge to its east, elongating it and shaping southerly flow aloft over the Isthmus of Tehuantepec. This may have been one mechanism by which a subtle cap was reinforced over Otis, having the dual effect of both preventing Otis's vortex column from extending to the tropopause but also protecting the vortex from disruption by the layer of westerly winds aloft.

HAFS-A azimuthal temperature anomaly showing Otis's warm core being entirely restricted below 600 hPa at 00:00 UTC on October 24

This lid seems to have been effective in squashing Otis's vortex, but deep convection did occasionally penetrate this layer. This convective activity primarily occurred downshear (to the west), giving Otis the appearance of having an exposed low-level center of circulation on satellite imagery. However, the low-level cloud deck was quite robust, extending about 10,000 ft up with cloud tops registering about 0C. Despite the meager appearance in the infrared and visible bands, microwave overpasses during the afternoon of October 23 revealed that Otis was far more organized than expected: the concentrated low-level latent heat release had been sufficient to build a remarkably coherent vortex marked by a low-level eye feature despite the otherwise sheared look. A "cyan ring" emerged on 37 GHz color-composite imagery, a portent of rapid intensification. All that this structure would need to take off was some way to get past the lid aloft.

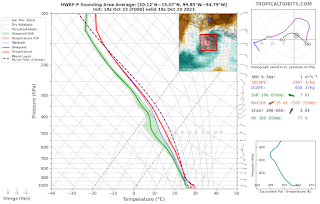
HWRF mean sounding on 18z October 23, showing a stout MSE minimum aloft

It appears that the guidance's expectation that Otis would remain weak hinged on Otis being unable to break this lid. However, the placement of Otis's convection would rapidly swing things in the storm's favor. Otis had been preferentially firing deep convection off on its western side. While the upper-level winds near the outflow layer pushed these storms west away from Otis's center, the westerlies at 400-600 hPa did the opposite. As these updrafts grew and decay, detrained cloud droplets and precipitation would have been advected east over the center of circulation. Any evaporation of this detraining mass flux would have led to cooling aloft in the 400-600 hPa: directly over the capped convection and precisely at the mid-tropospheric moist static energy minimum. It's my conjecture that, eventually, enough destabilization occurred aloft from this efficiently placed detraining moisture that the lid was broken, allowing for Otis's core to axisymmetrically erupt on the night of October 23 and setting up an extreme intensification the following day that led to Otis's Category 5 intensity. Additionally, the westerly flow aloft relaxed and sea surface temperatures increased from 29C to 31C around the time that this lid was broken, which appears to have occurred after 00:00 UTC on October 24. These factors appear to have aided Otis's intensification and made the environment dramatically more conducive for rapid intensification during the course of that day.

Even with all of this in mind, I think that the magnitude of extreme intensification of Hurricane Otis would still be missed with our modern forecast aids, slipping past all explicit and probabilistic model guidance. However, I think there is value in reasoning about how such a significant event avoided detection until essentially the very last moment.

Regarding what I've conjectured to be building blocks in setting up and enabling Otis's unexpected rapid intensification, here are what I think are the key points:

  • For 1-2 days, Otis's vortex was restricted to below 600 hPa. This may have been associated with a low theta-e layer aloft, possibly reinforced by negative moist static energy advection from the Gulf of Mexico during Otis's early stages.
  • Otis's stumpy vortex avoided strong wind shear aloft, and the focusing of latent heat release in this somewhat deep but low-level layer efficiently strengthened the vortex and stockpiled moist static energy
  • Otis's propensity to fire deep convection north and west of the center of circulation was favorably positioned for westerly flow at 400-600 hPa to advect moisture from these updrafts directly over the center of circulation and the low-level core. This MSE advection occurred at the mid-tropospheric MSE minimum and directly above Otis's capped convection, inducing destabilization aloft.
  • The combination of destabilization aloft from repeated convective detrainment and warming sea surface temperatures eventually led to a collapse of the lid and a significant increase in convective vigor and storm intensity on the night of October 24-25.